
Background
- Developers were manually monitoring logs for incident response.
- However, there were limitations with log monitoring:
- Elasticsearch field mapping errors due to field type mismatches causing log event drops.
- If system logs were required (e.g., for stack traces), developers had to request them separately from the system engineers (SE), resulting in operational overhead.
Goal
- Establish a common Sentry integration standard for Go-based projects.
- Provide feature specifications and guidelines for Sentry usage.
- Build a stable service foundation through faster incident response after Sentry adoption.
This document assumes that a Sentry account and a Sentry project are already set up.
About Sentry
- Capture Exception
Automatically detects and records exceptions and errors in applications. Sentry provides stack traces and environment information at the time of error occurrence, making it easier to identify root causes.
- Transaction Monitoring
Monitors application performance by tracking transactions such as web requests or API calls, providing response times, success rates, and error rates.
- Tracing
Tracks transactions in detail, analyzing service-to-service calls and database queries to identify bottlenecks.
- Alerts
Manages issues and notifies via email, Slack, etc., when problems arise. Developers can be assigned to issues and collaborate on resolutions.
- Release Tracking
Tracks application versions and analyzes the impact of new releases on error rates, helping detect problems introduced by recent deployments.
Sentry Alerts
Set up Sentry alerts integrated with collaboration tools for easy developer response.
Setup Step-by-Step
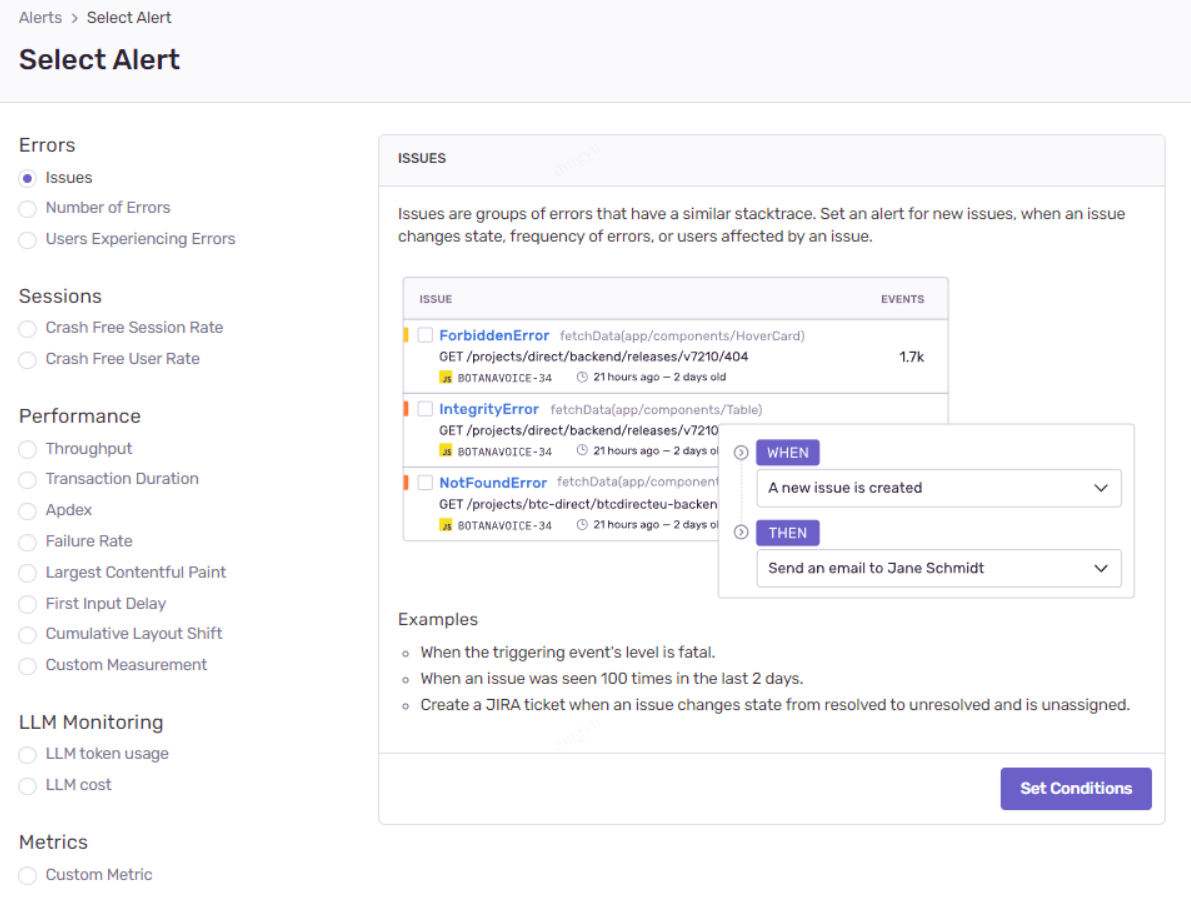
Dashboard > Alerts > Create Alert

Trigger Setup
- Issues: Trigger alerts based on stacktrace patterns (e.g., API HTTP status code-based, service category-based).
- Number of Errors: Trigger alerts based on error occurrence counts.
- Users Experiencing Errors: Trigger alerts when a threshold number of users experience errors (e.g., 100 users failing to log in).
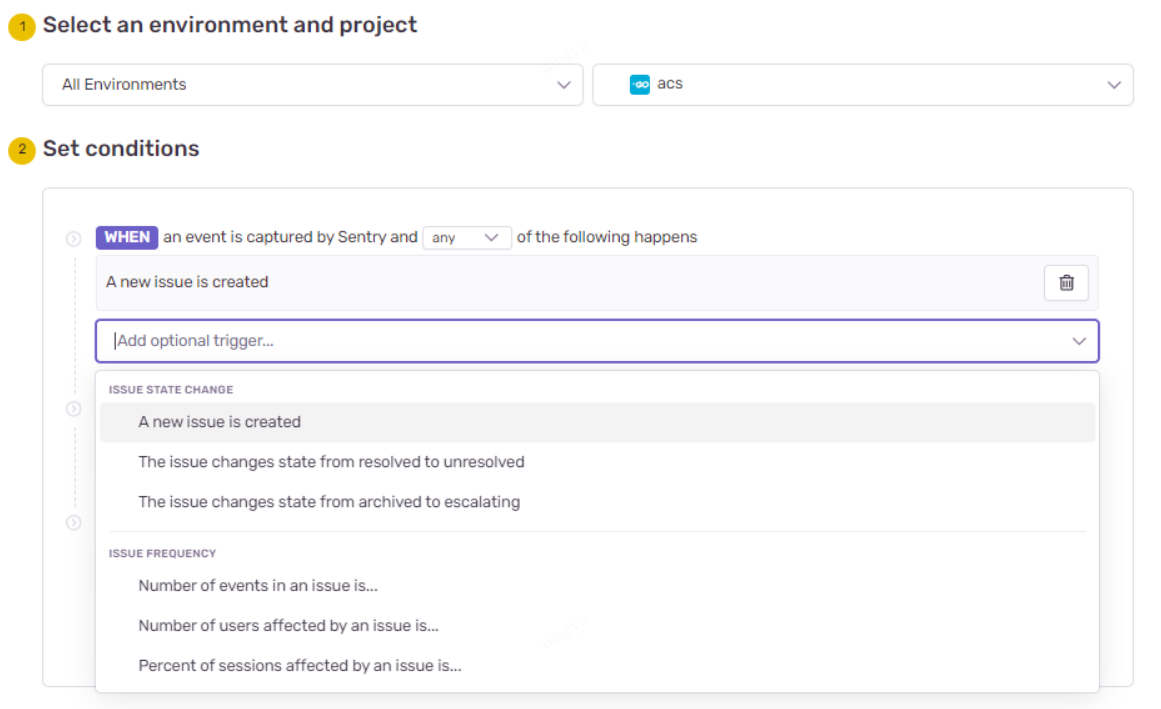
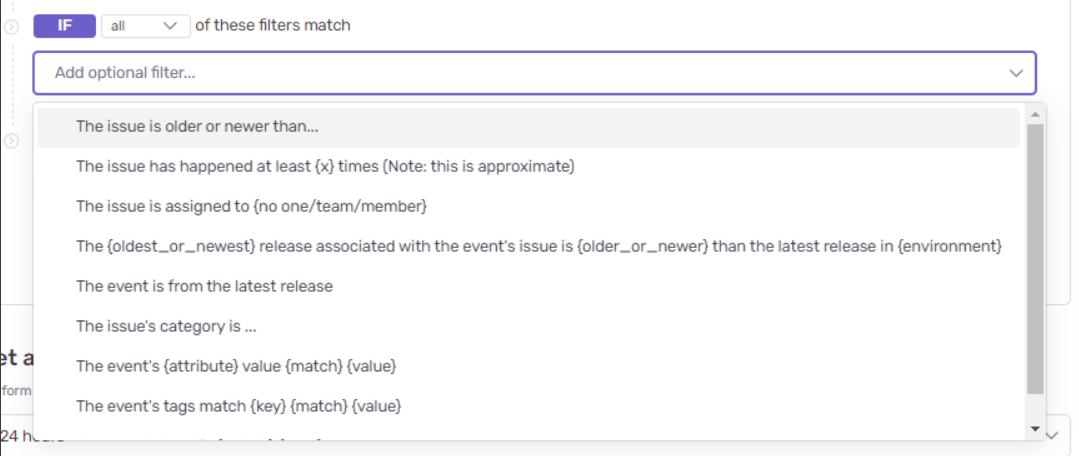
Detailed Conditions
- WHEN: Define when the alert should trigger (any vs. all conditions).
- IF: Specify detailed conditions like tags, frequency, or categories.
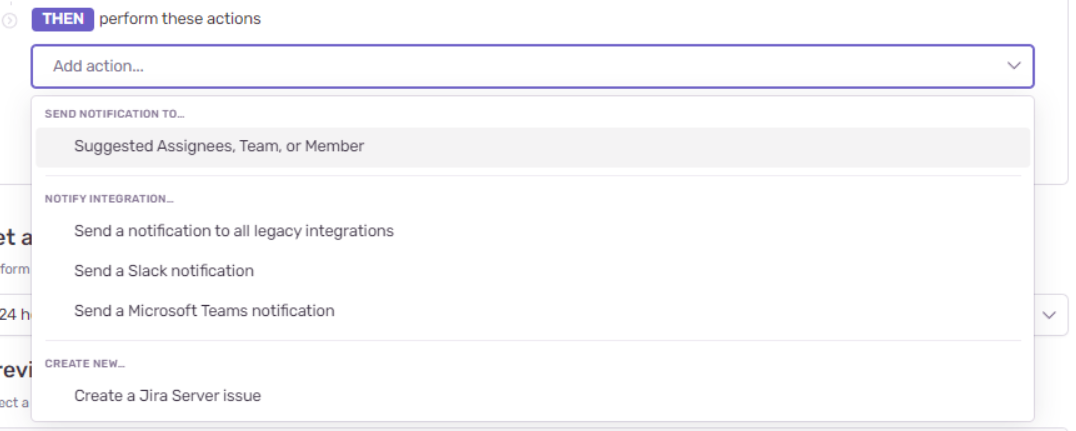
Action Selection
- Send notifications to Email, Slack, Teams, etc.
Development
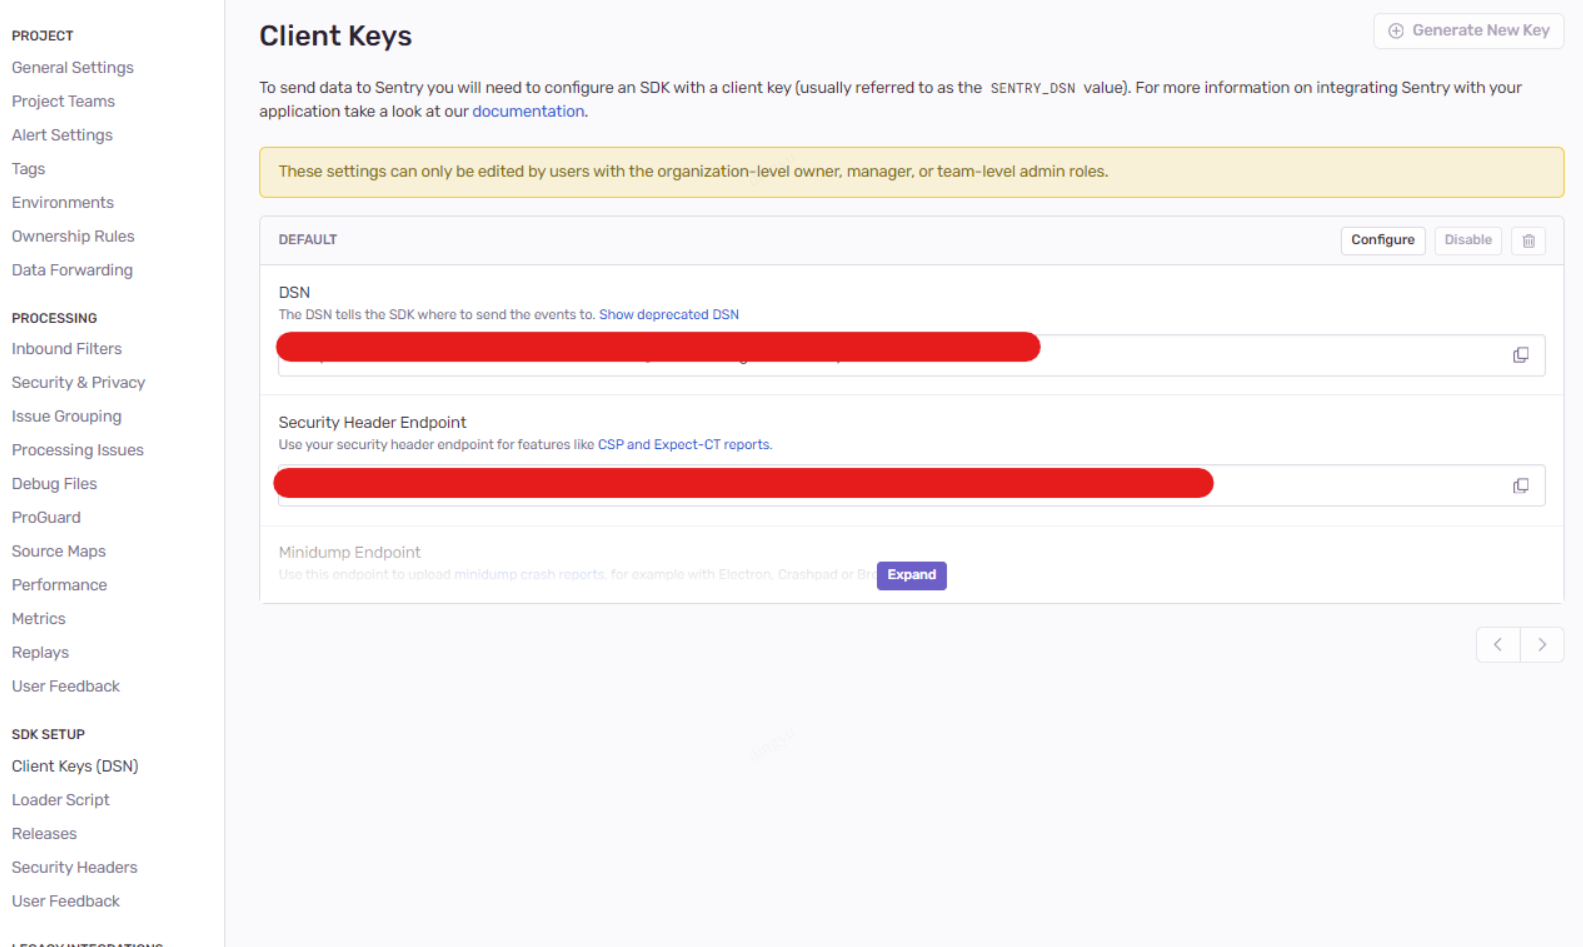
Client Options
- DSN: Unique string identifying the Sentry project.
- Environment: Specify the runtime environment (e.g., production, staging, development).
- Release: Track the application version where the error occurred.
- SampleRate: Control the proportion of reported events (e.g., 0.1 means 10% sampling).
- TracesSampleRate: Similar to SampleRate but for performance data.
- BeforeSend: Callback to modify/filter events before reporting.
- AttachStacktrace: Include stack traces in logs.
- ServerName: Specify server name for better error grouping.
- Integrations: Set additional integrations with frameworks and libraries.
- Transport: Customize event transport, including timeout settings.
Initialize
Best practice is to call sentry.Init() at the application’s entry point (main.go).
err := sentry.Init(
    sentry.ClientOptions{
        Dsn:              config.Sentry.DSN,
        SampleRate:       config.Sentry.SampleRate,
        EnableTracing:    config.Sentry.EnableTrace,
        Debug:            config.Sentry.Debug,
        TracesSampleRate: config.Sentry.TracesSampleRate,
        Environment:      config.Sentry.Environment,
        AttachStacktrace: true,
        Transport: &sentry.HTTPSyncTransport{
            Timeout: config.Sentry.Timeout,
        },
    },
)
Capture Exception
Capture and track exceptions automatically:
hub := sentry.GetHubFromContext(ctx)
if hub == nil {
    hub = sentry.CurrentHub().Clone()
    ctx = sentry.SetHubOnContext(ctx, hub)
}
hub.CaptureException(err)
Stack Trace Differences: Go errors vs pkg/errors
- errors package: Does not capture stack traces.
- github.com/pkg/errors: Includes stack traces automatically.
Test example:
return pkgErr.Wrap(PkgErr1, PkgErr2.Error())
Scope()
Scope allows attaching contextual metadata (e.g., request parameters) to events.
hub := sentry.GetHubFromContext(r.Context())
if hub == nil {
    hub = sentry.CurrentHub().Clone()
    r = r.WithContext(sentry.SetHubOnContext(r.Context(), hub))
}
hub.Scope().SetRequest(r)
Sentry Advancement
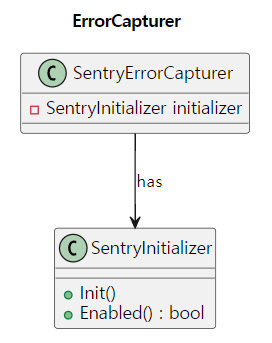
SentryInitializer
Manages singleton initialization of the Sentry client:
type SentryInitializer struct {
    conf    *Config
    enabled bool
    mutex   sync.RWMutex
}

func (si *SentryInitializer) Init() error { ... }
func (si *SentryInitializer) Enabled() bool { ... }
Manages concurrent access safely with mutex.
ErrorCapturer
Captures exceptions through the Sentry Hub:
type ErrorCapturer interface {
    CaptureError(ctx context.Context, err error)
}
Handles Hub setup and error capture internally.
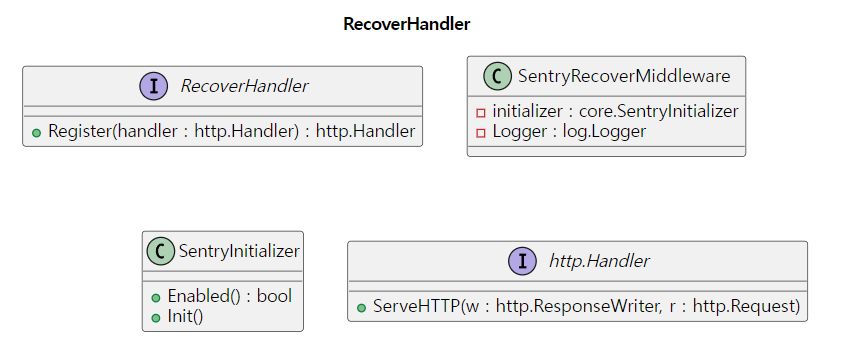
RecoverMiddleware
Handles panics and automatically logs to Sentry:
defer func() {
    if err := recover(); err != nil {
        hub.RecoverWithContext(r.Context(), err)
        // Log stack trace
    }
}()
Even in panic scenarios, proper logging and Sentry reporting is ensured.
Despite its cost, Sentry offers great convenience for both APM and error capture management!