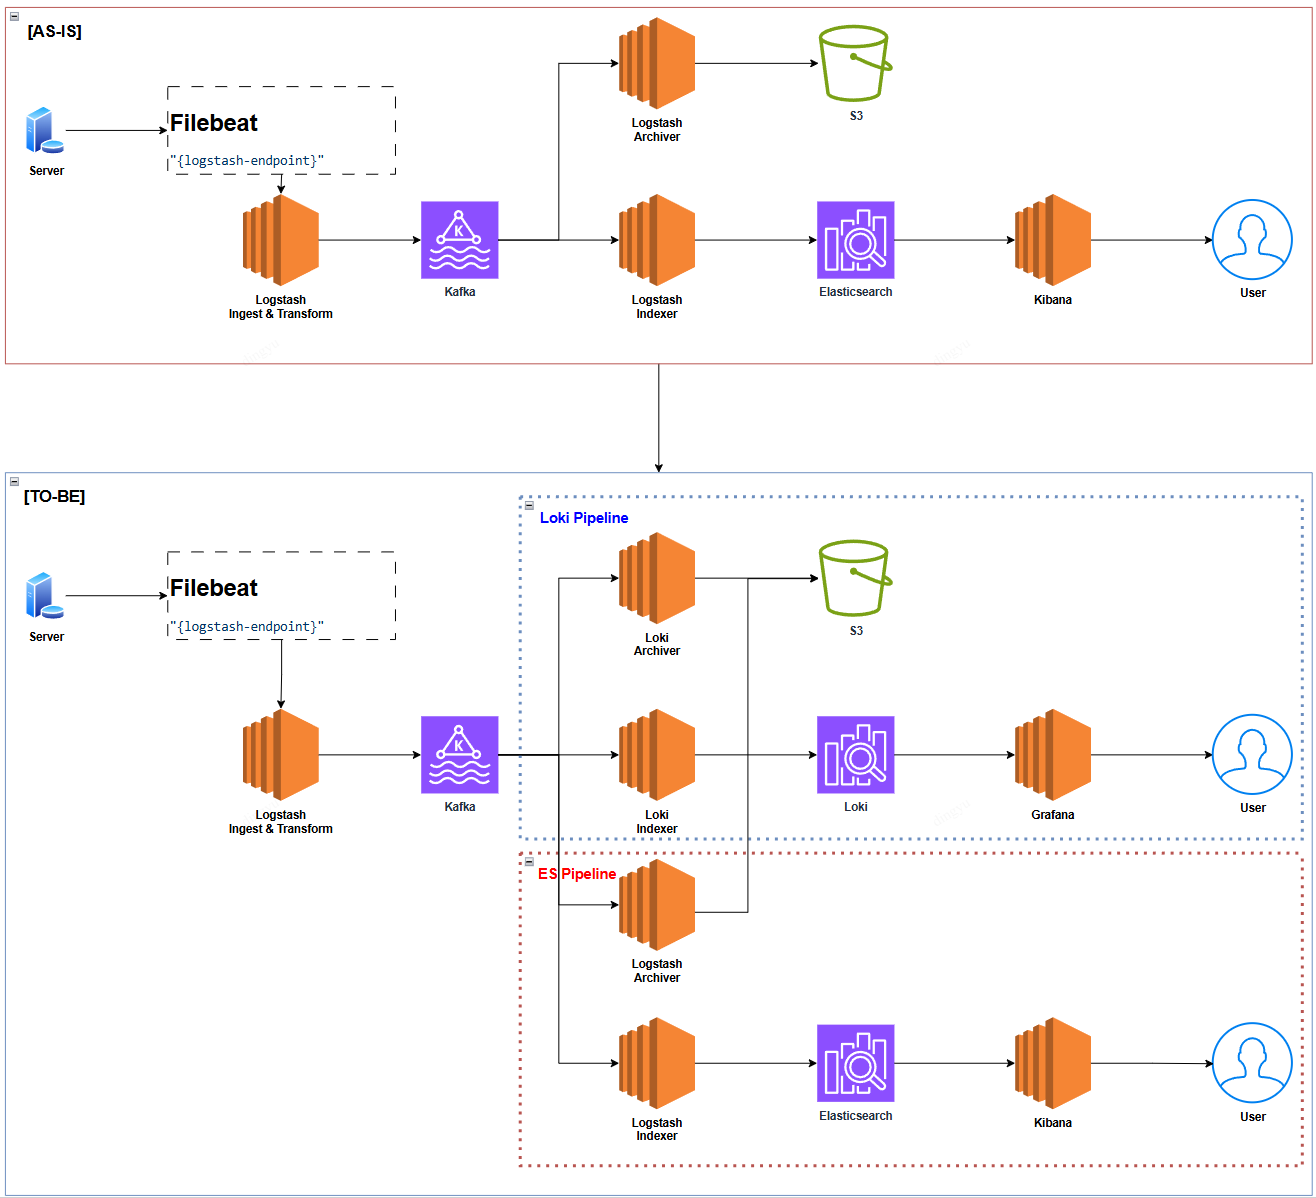
Why Loki?
In backend applications, we often used Elasticsearch queries to investigate user issues and visualized dashboards using Kibana for operational teams.
If asked, “Why switch to Loki?” the answer is simple: “To reduce cost!”
| Category | Loki 🟢 | Elasticsearch 🔴 |
|---|---|---|
| Storage Model | Stores metadata only; raw logs in object storage | Indexes and stores all logs |
| Search Method | Label-based search | Full-text search |
| Indexing Cost | Low | High (CPU/memory intensive) |
| Storage Cost | Cheap (S3/GCS object storage) | Expensive (dedicated nodes needed) |
| Performance | Efficient for massive log storage | Fast for query |
| Scalability | Easy to scale with simple configuration | Cluster scaling is more complex |
| Ops Overhead | Low (no need to manage cluster) | High (cluster management required) |
| Use Case | Simple log storage and retrieval | Complex analysis and search |
Pre-Migration Checklist
- No need to expose dashboards to external stakeholders?
- Do you only need basic log viewing during incidents?
Notes When Integrating Loki
When labels are too diverse or contain too many unique values, Loki’s indexing becomes inefficient.
- Example: assigning fields like
user_idortimestampas labels can cause a rapid index size increase.Consequences:
- Slow query performance
- High memory usage
- Increased storage cost
Use Fixed, Low-Cardinality Labels
To keep cardinality low:
- Use static or limited-range values as labels
- Examples:
- Good 😊:
region="us-east-1",app="payment-service" - Bad 😥:
user_id="12345",request_id="abcd-efgh"
- Good 😊:
Only Use Labels Relevant to Filtering
Design labels based on how you plan to filter/search logs in dashboards:
- Use labels only for data that will be filtered or analyzed
- Avoid labels used solely for debugging
- Examples:
- Good 😊: For tracking TPS/latency, design labels around logs that appear once per request → e.g.
func="LogMiddleware.Log" - Bad 😥: Using
latencyitself as a label
- Good 😊: For tracking TPS/latency, design labels around logs that appear once per request → e.g.
Separate Log Message from Metadata
Labels should serve as tags. Dynamic values should go inside the log message.
- Examples:
- Good 😊:
label:func="RestrictionsService",log: member_id="12341512321", message="restricted member" - Bad 😥:
label:member_id="12341512321",log: message="restricted member", func="RestrictionsService"
- Good 😊:
Limit the Number of Labels
Too many labels = high cardinality → indexing inefficiency.
- Loki’s official recommendation: keep labels under 20.
Limit Unique Values per Label
Loki recommends fewer than 1,000 unique values per label.
- Acceptable:
status="200",status="500" - Avoid:
user_id="12345",session_id="abcd-efgh" - Examples:
- Good 😊:
env="production",service="payments",region="us-east-1" - Bad 😥:
user_id="12345",request_id="xyz-789"
- Good 😊:
Tune Chunk Size and Retention
Loki stores logs in chunks and flushes them to object storage periodically.
- Too small chunks → low performance
- Too large chunks → slow search
- Recommended:
chunk_encoding: gzipchunk_target_size: 1MB~2MB(adjust as needed)
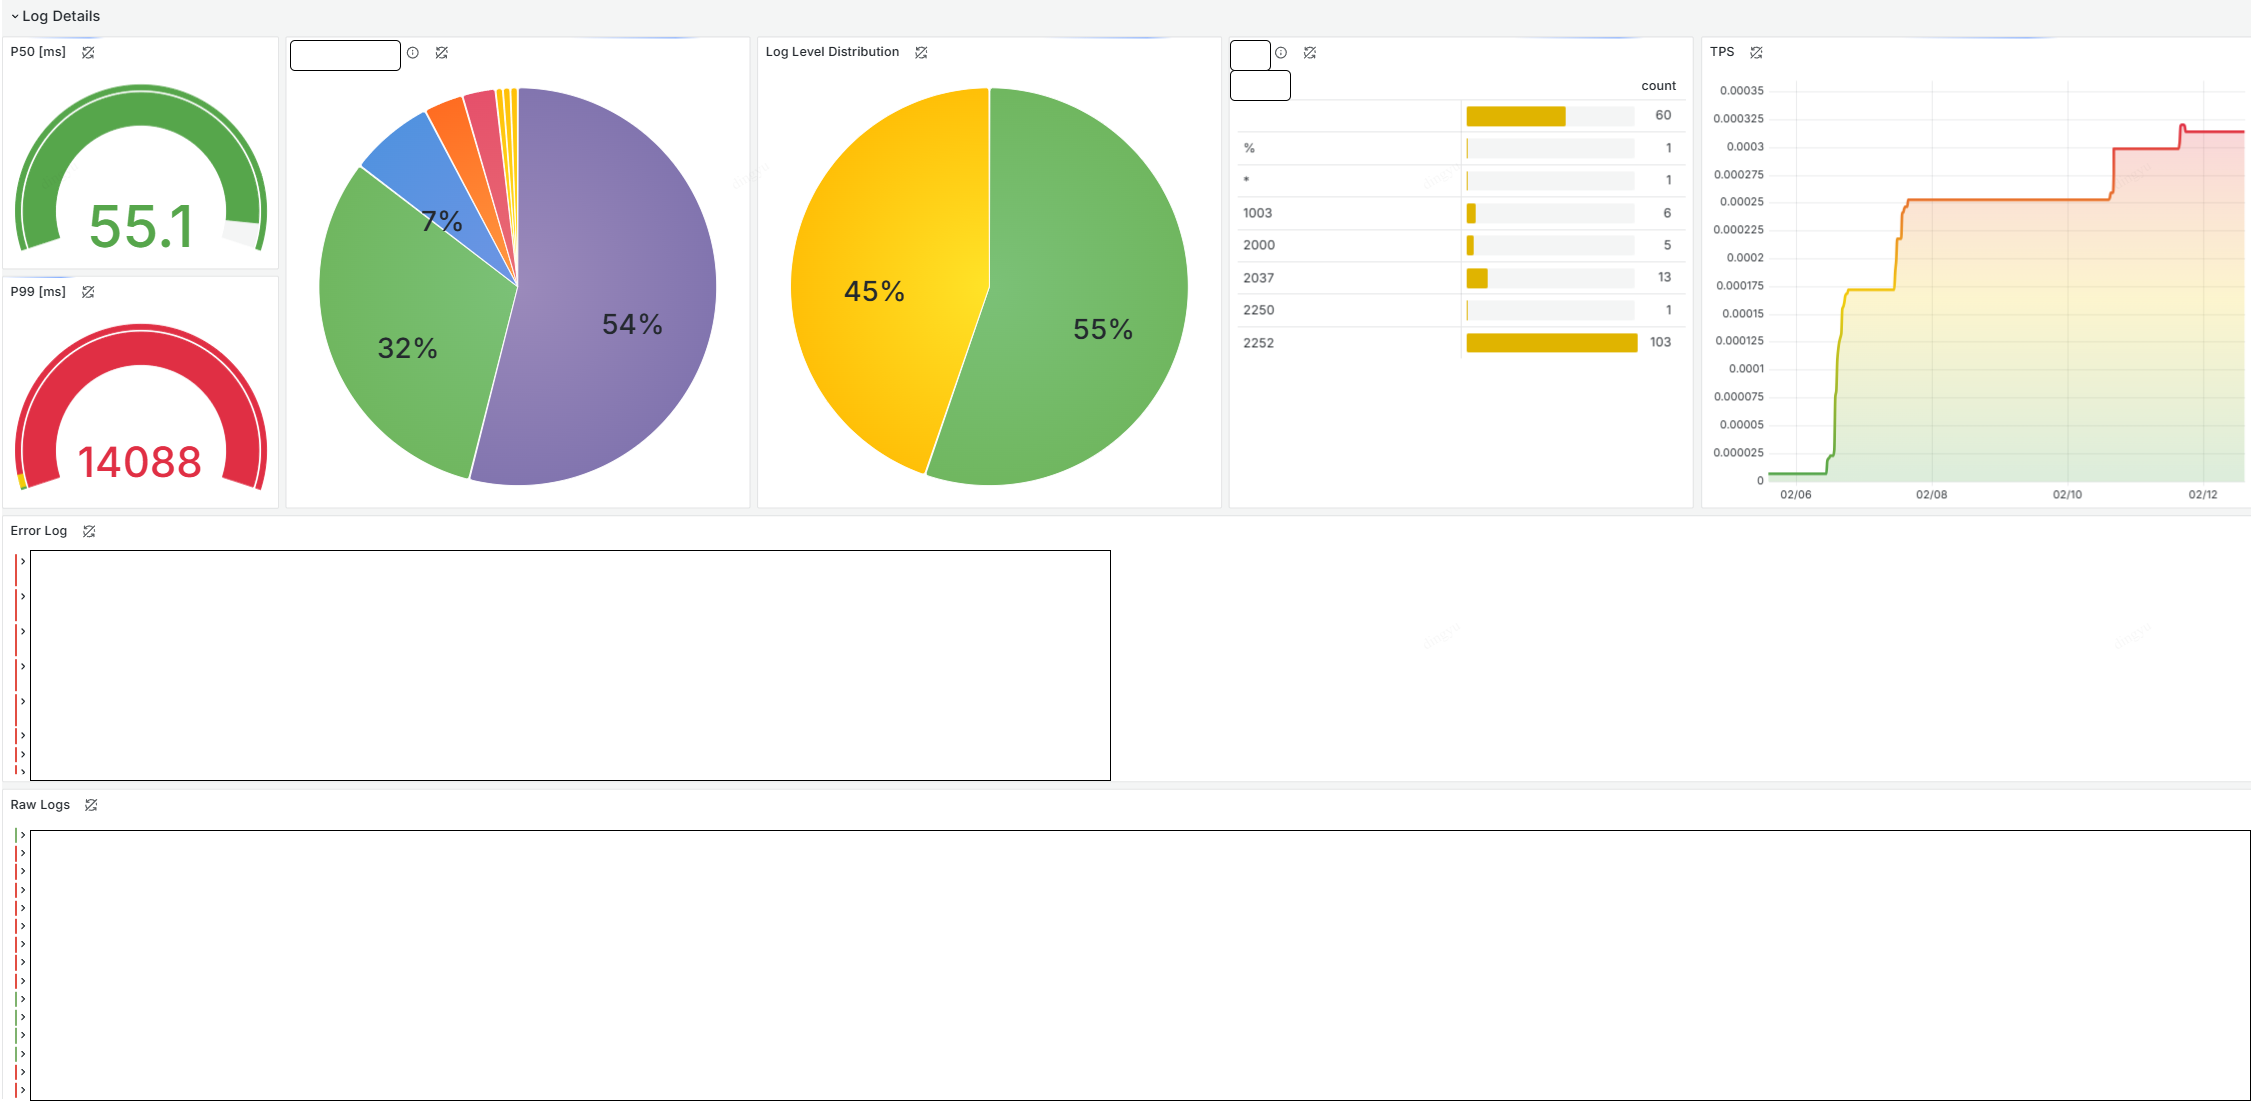
Building the Dashboard
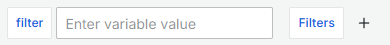
1. Set Up Variables
While filtering with Variables adds complexity, it’s a gift to your future self.
Application logs are usually queried using raw log, so choose frequently used filter labels as variables.
Also add text box filters to refine the filtered results.
2. Build Raw Logs Panel
Start with a global log viewer using Logs Visualization.
Example:
{_type="loki"} |= `$filter`
3. Filter Error Logs by Log Level
From raw log, duplicate and filter only error level logs.
Some business logic might bypass error tagging—make sure log levels are properly set.
Example:
{level="error"}
4. Track TPS with Quantiles
Precision = speed. Use P50, P99 as standard metrics with Gauge Visualization using quantile_over_time.
Note:
- Unlike Prometheus TSDB, Loki doesn’t compute percentiles efficiently
- High volume log ranges may degrade performance
quantile_over_timeis memory intensive and expensive at large time ranges
Example:
quantile_over_time(0.50, {func="LogMiddleware.Log"} |= `$filter` | json | unwrap latency [$__range]) by (func)
5. Build Distributions by Label
Use Piechart to understand overall log distribution.
Labels must be used, so apply this only to unique label values
Example:
sum by(method) (count_over_time({func="LogMiddleware.Log"} |= `$filter` [$__auto]))
6. Use Table to Visualize and Filter Distributions
Table is great for at-a-glance inspection. You can make labels clickable for filtering.
Example:
sum by(method) (count_over_time({func="LogMiddleware.Log"} |= `$filter` [$__auto]))
Final Dashboard